Why Where Money Went?
A simple and private way to understand your spending.
Where Money Went helps you analyze your expenses without sacrificing privacy. Everything runs directly on your device - no accounts, no cloud sync, no tracking of your financial data.
Just upload a CSV file from your bank and instantly see where your money goes.
We use anonymous analytics (via Umami) only to understand which features people use - never your personal data or transaction details.
Step-by-step guide
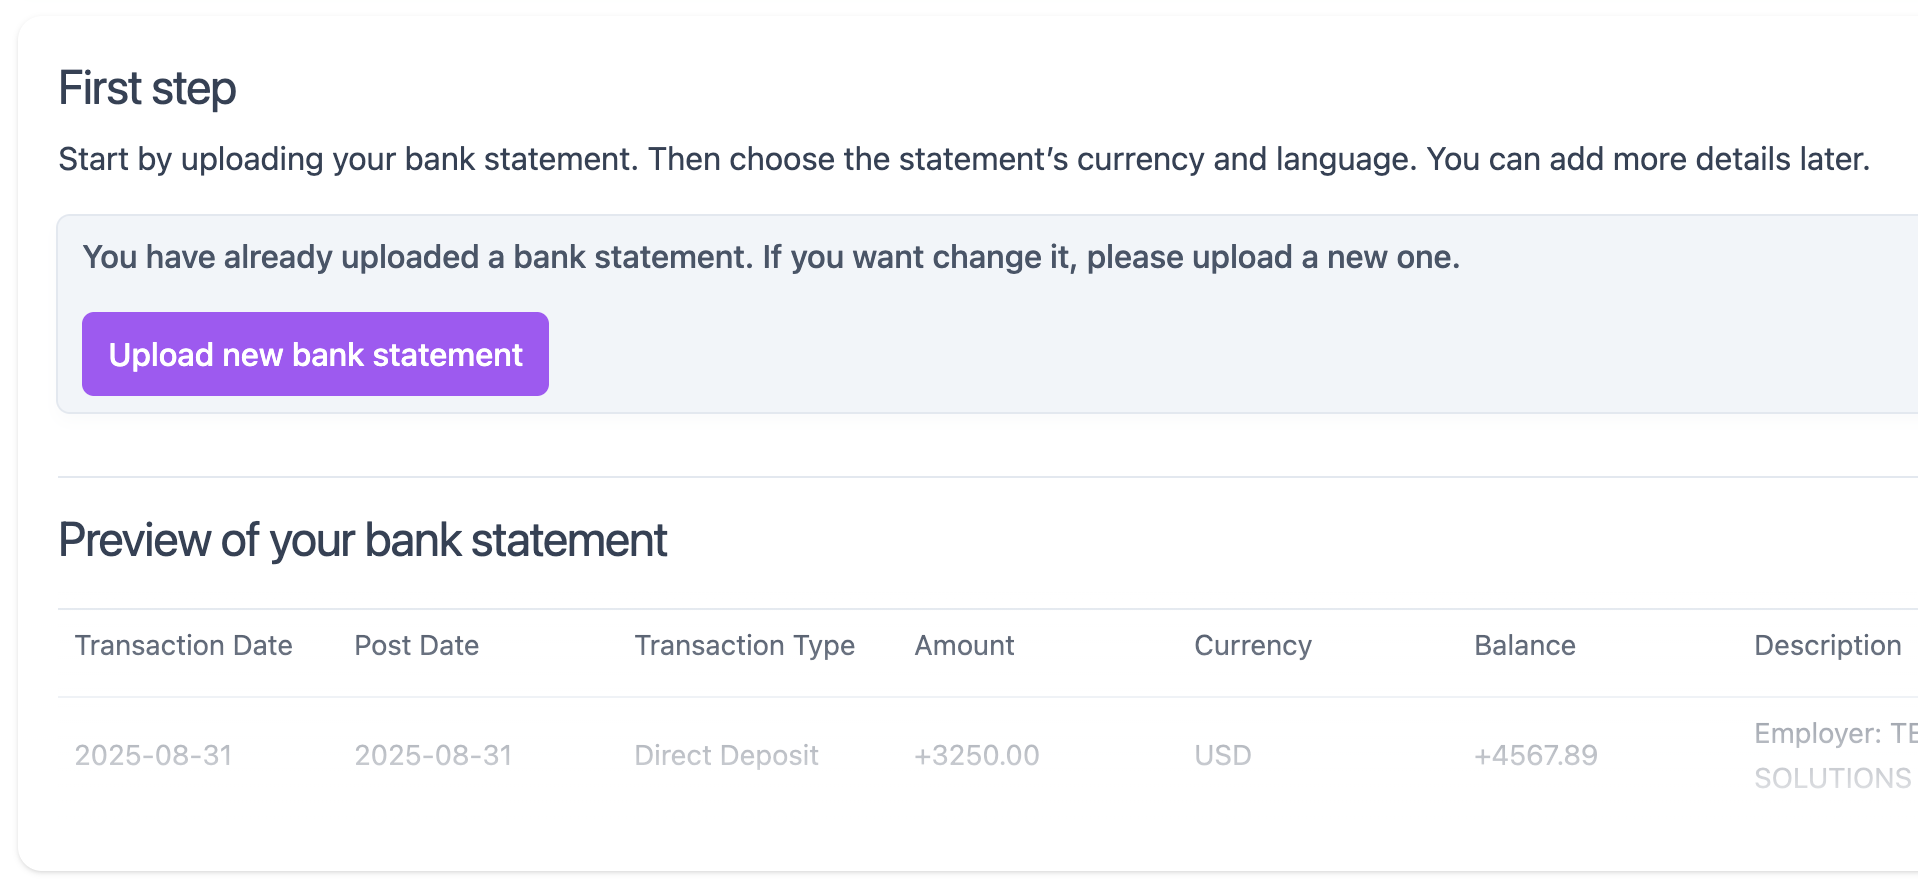
Step 1: Upload your bank statement
- Open the Where Money Went website.
- Click Choose file to upload.
- Select the CSV file exported from your bank.
- After processing, you’ll see a preview (first row) along with detected metadata.
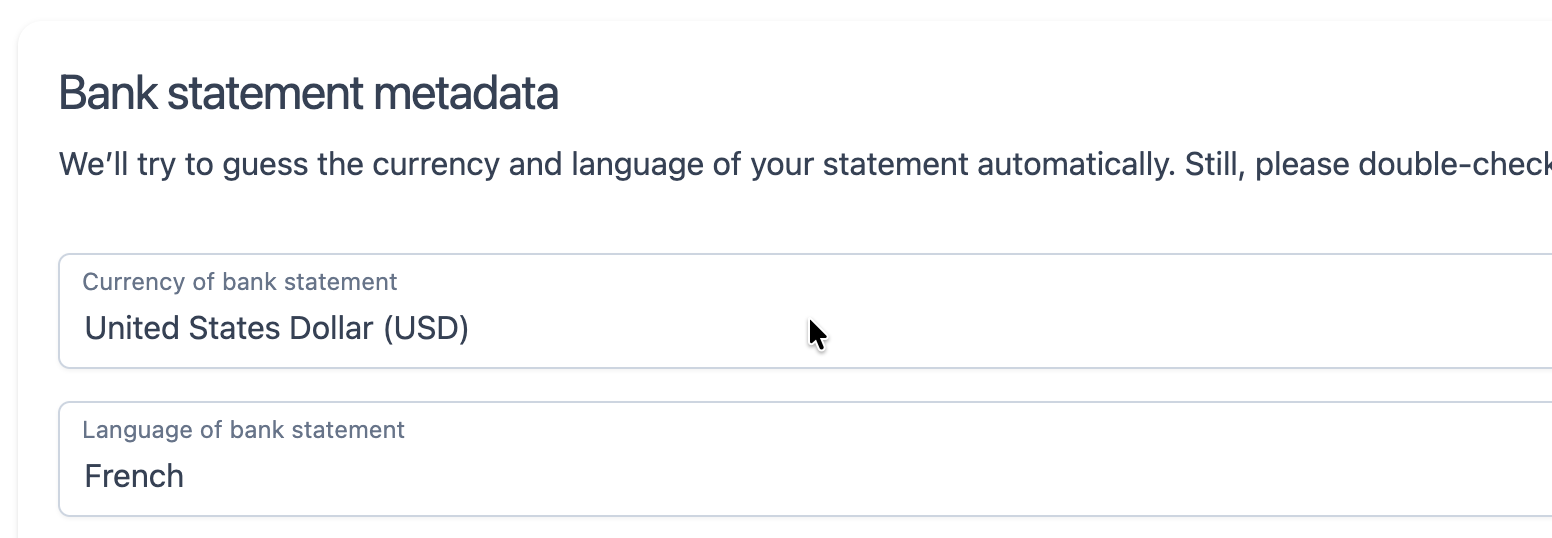
Step 1.1: Verify metadata
Make sure the automatic detection is correct:
- Select the currency of your statement.
- Select the language of your statement.
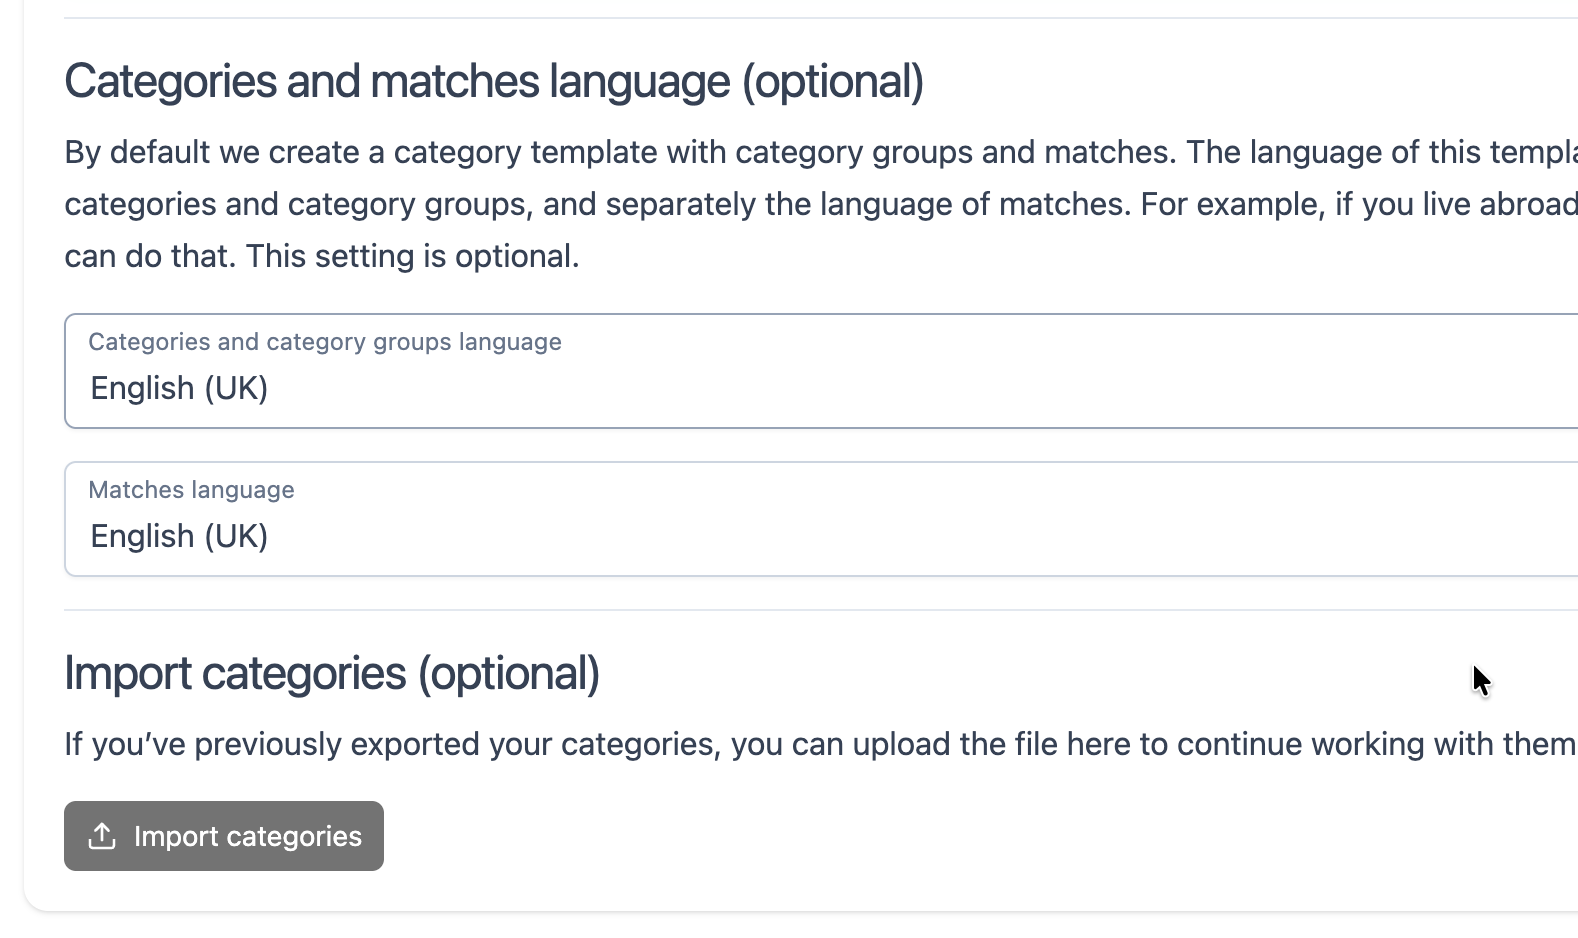
Step 1.2: Optional - Category and match languages (advanced)
Categorization works on a rule-based system.
You can adjust or create your own categories later.
For the first import, it’s best to confirm the languages we’ll use for default category and match templates.
- Select the category language.
- Select the category match language.
Step 1.3: Optional - Upload your own category template
Use this only if you’ve previously exported your categories as a JSON file.
- Click Import categories.
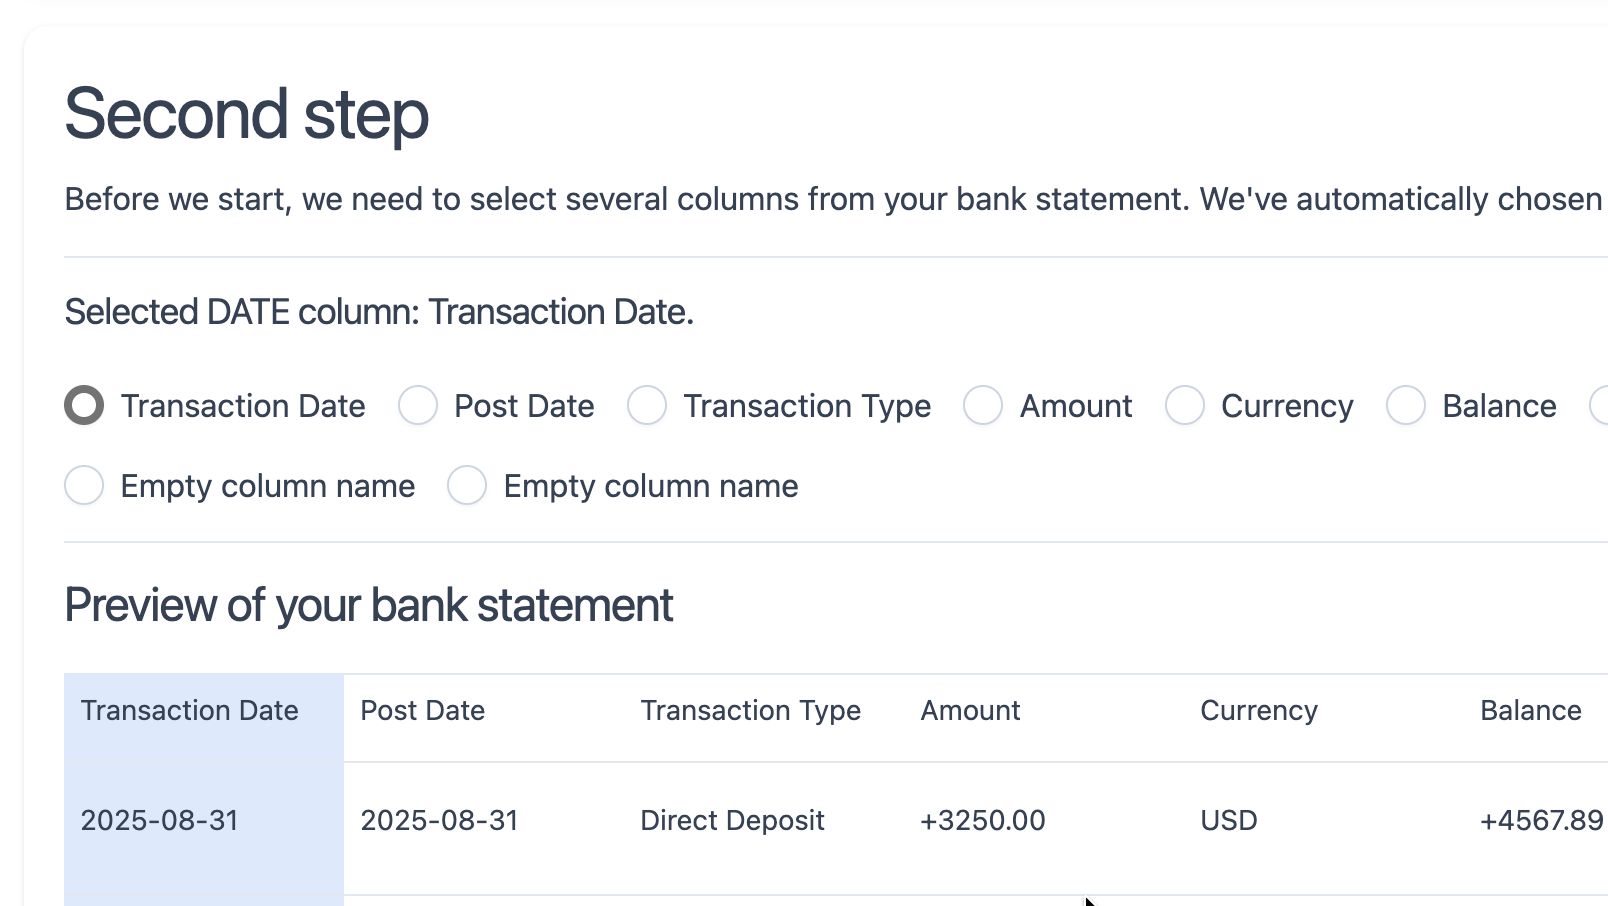
Step 2: Choose the transaction date column
We detect this automatically, but verify that the correct column is selected.
The detected column will be highlighted in the preview.
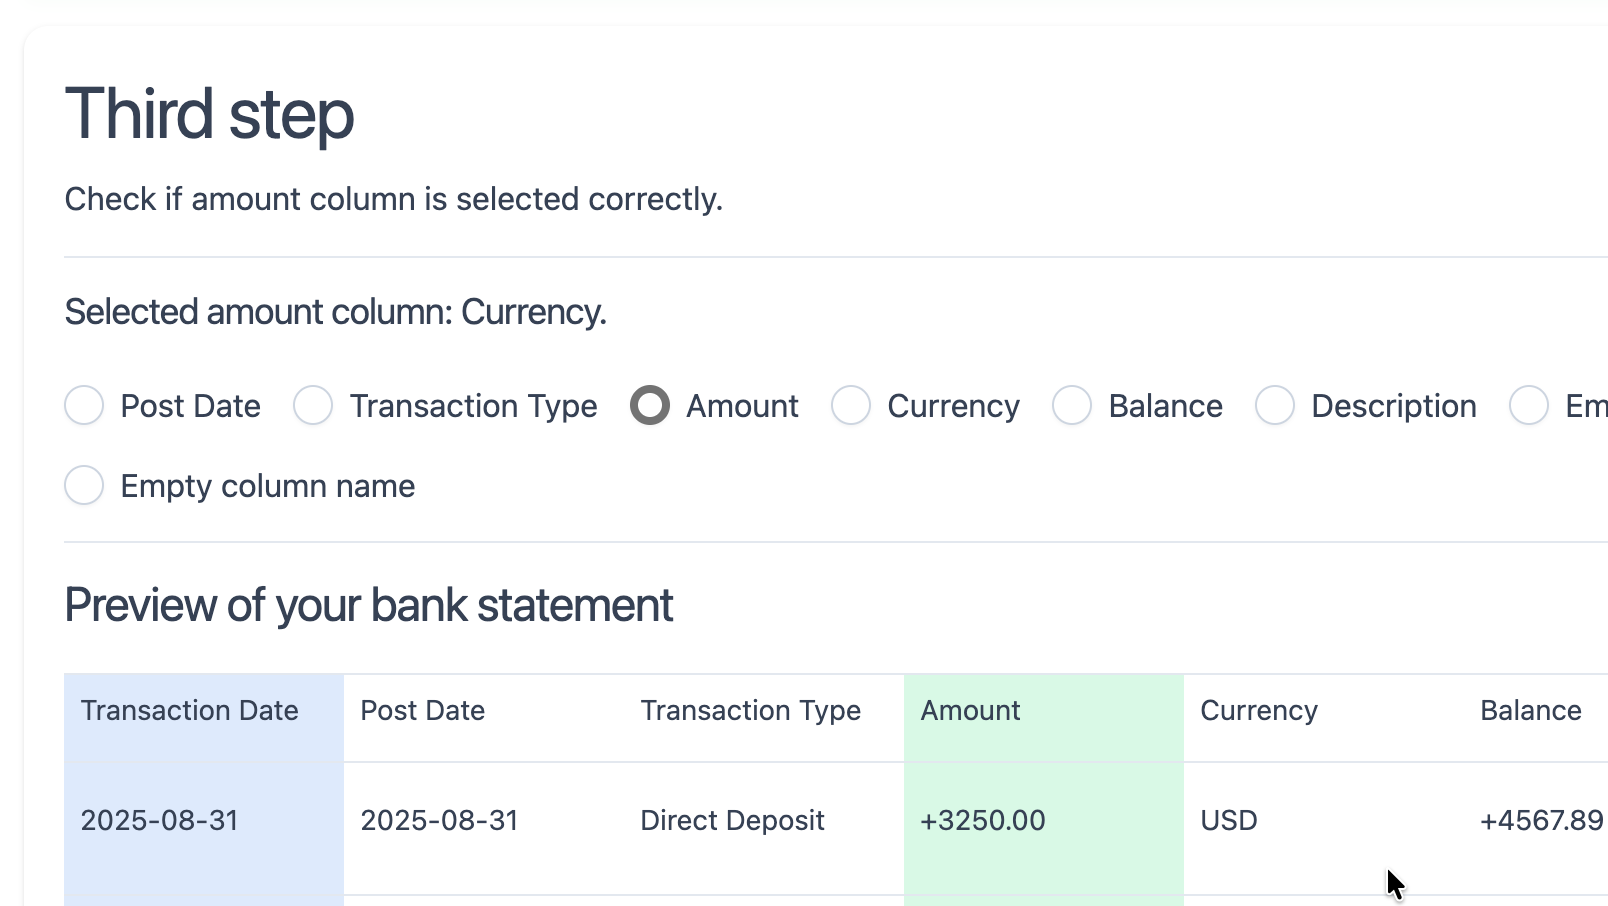
Step 3: Choose the transaction amount column
Again, we detect this automatically, but double-check it.
The highlighted column in the preview should contain transaction amounts.
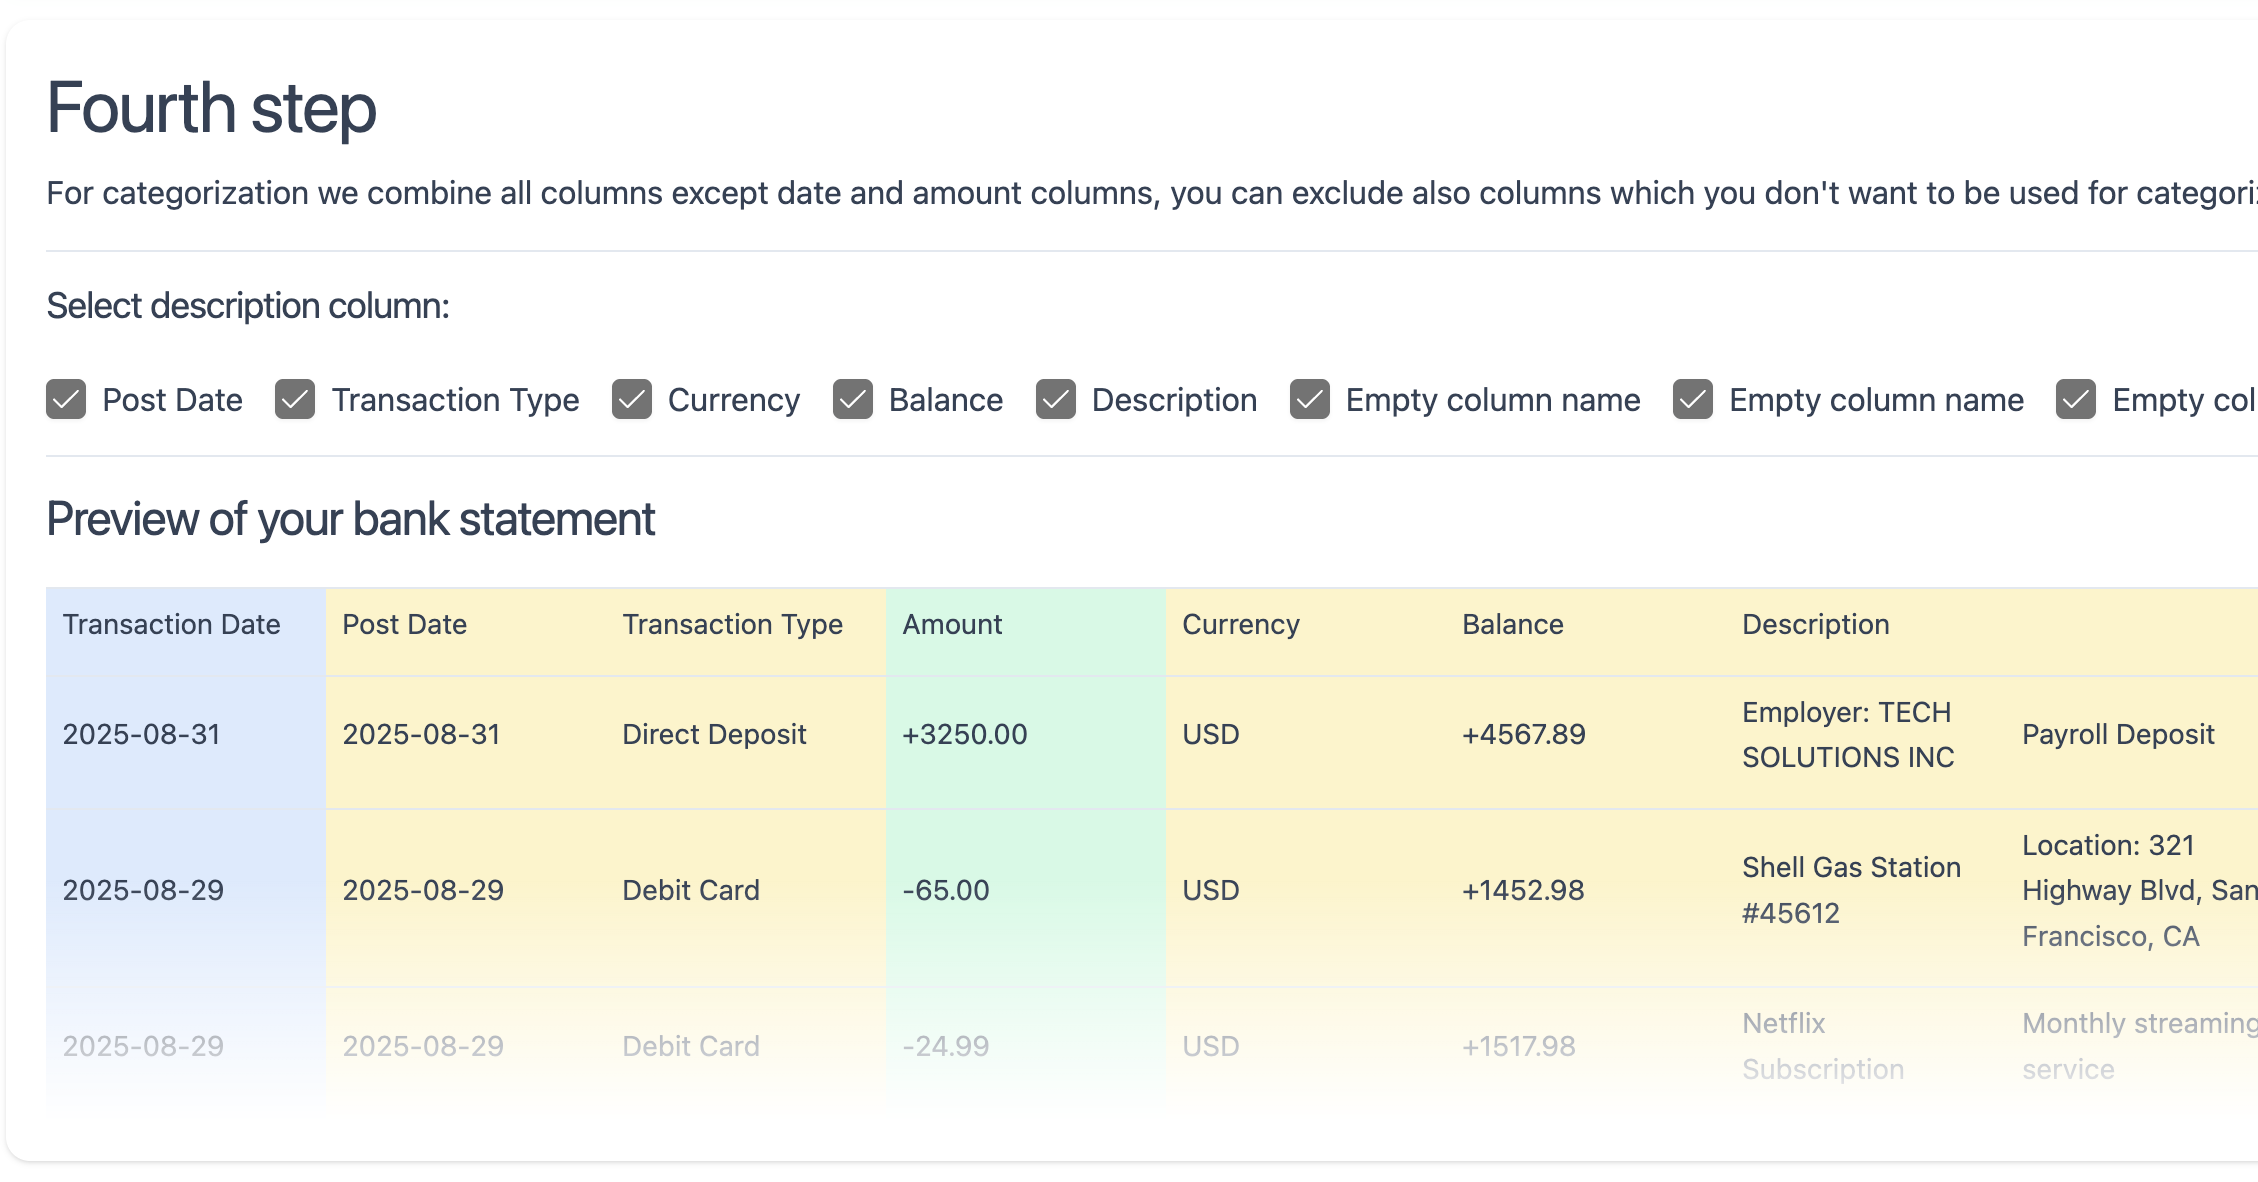
Step 4: Choose transaction description columns
All non-date and non-amount columns are selected by default.
You can manually adjust which columns should be used to build the transaction description.
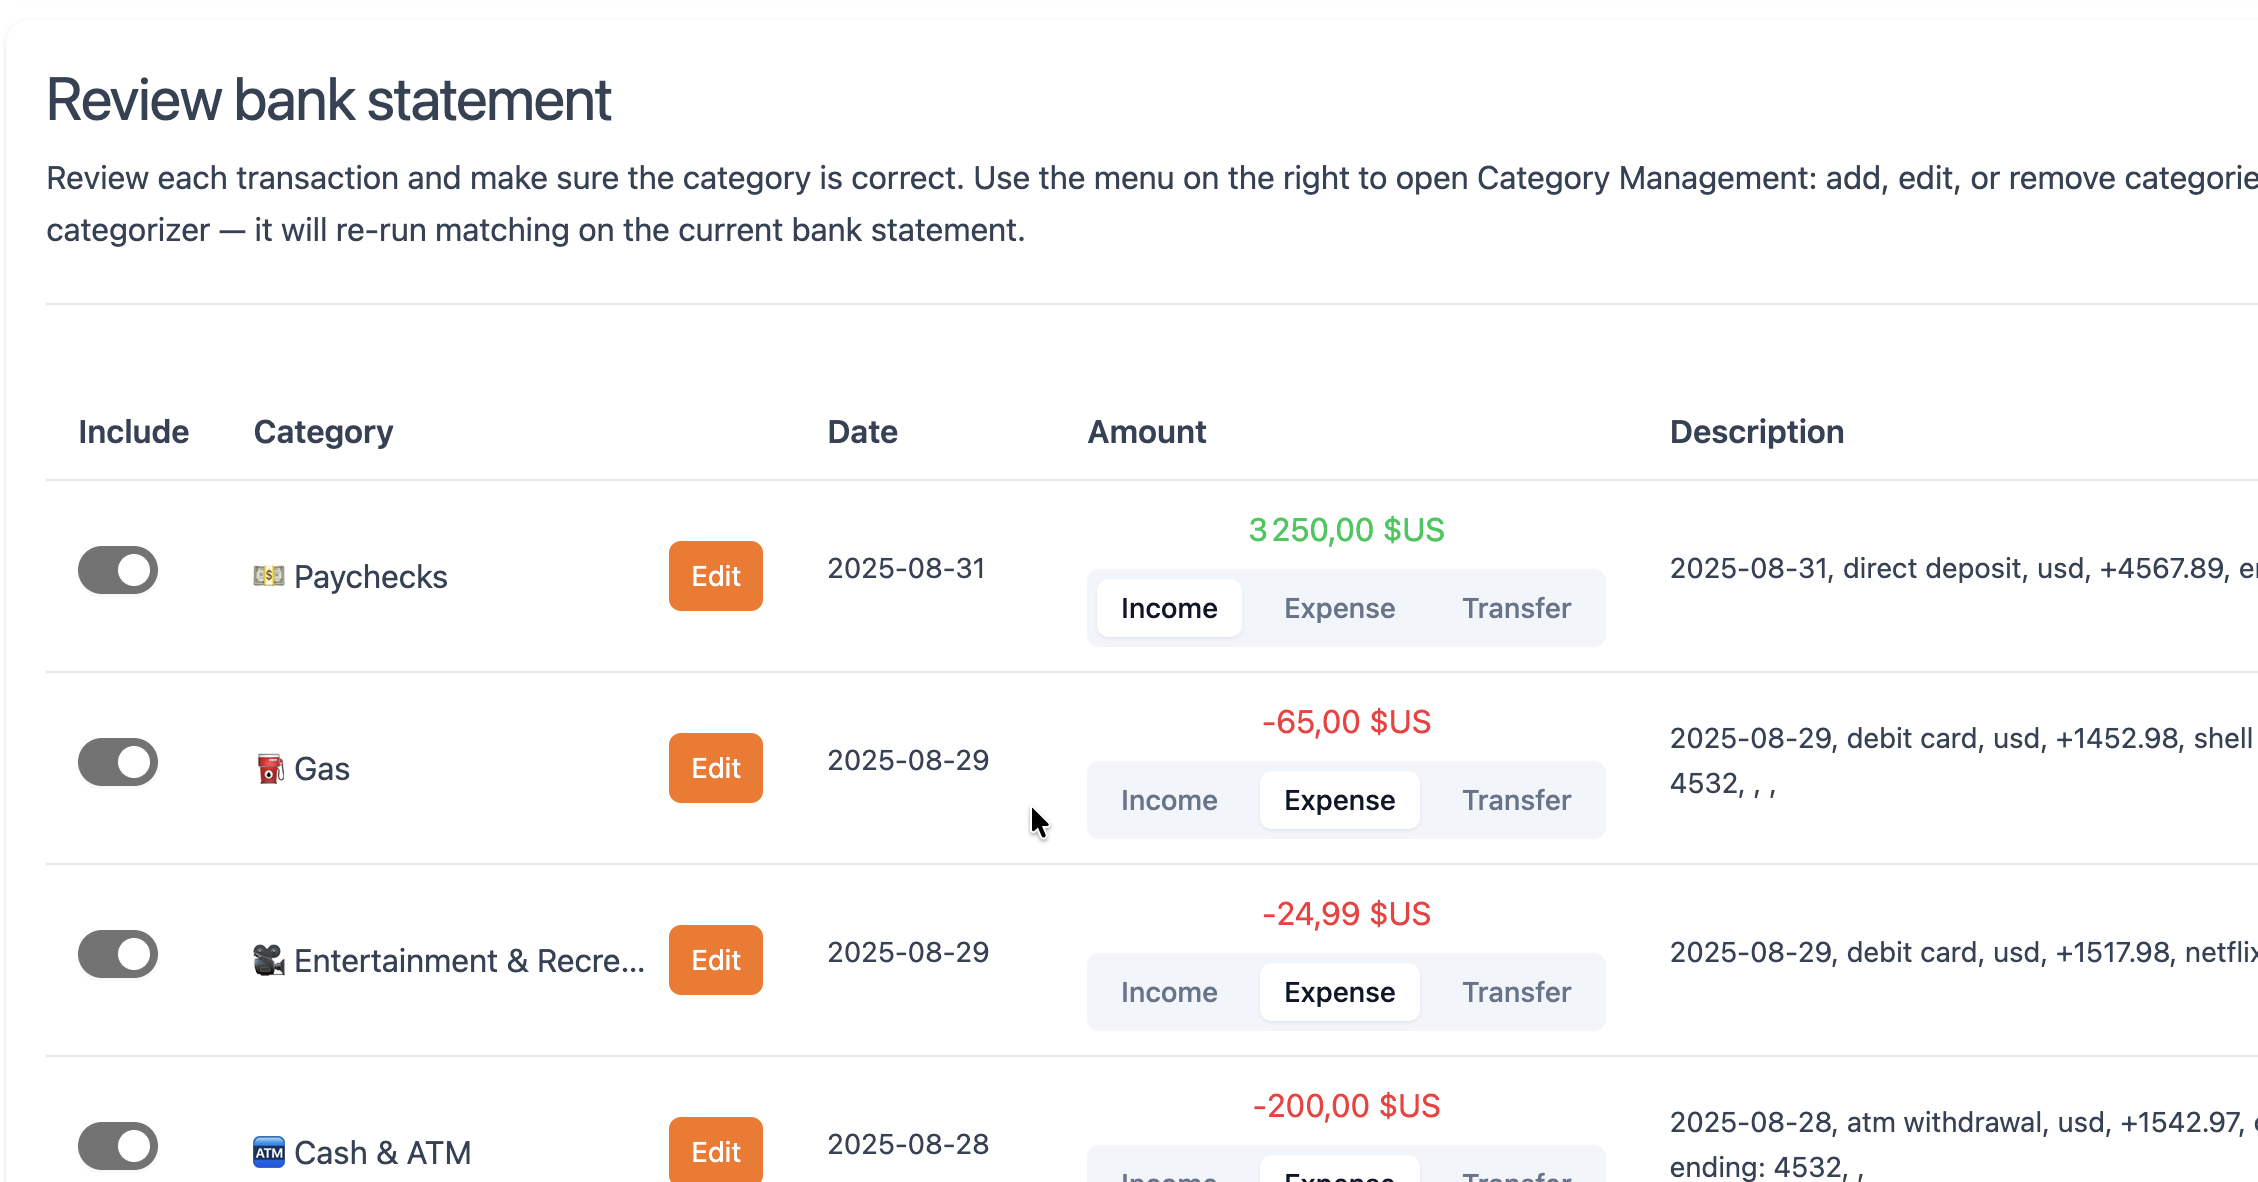
Step 5: Categorize transactions
Your transactions will be categorized automatically based on description matches.
You can override anything manually:
- Each row has an Include toggle - turn it off if you don’t want a row included in the analysis.
- The Category column has an edit button for changing or creating categories and matches.
- Select the amount type: Income, Expense, or Transfer (detected automatically but worth checking).
- A side menu lets you open category management or re-run automatic categorization.
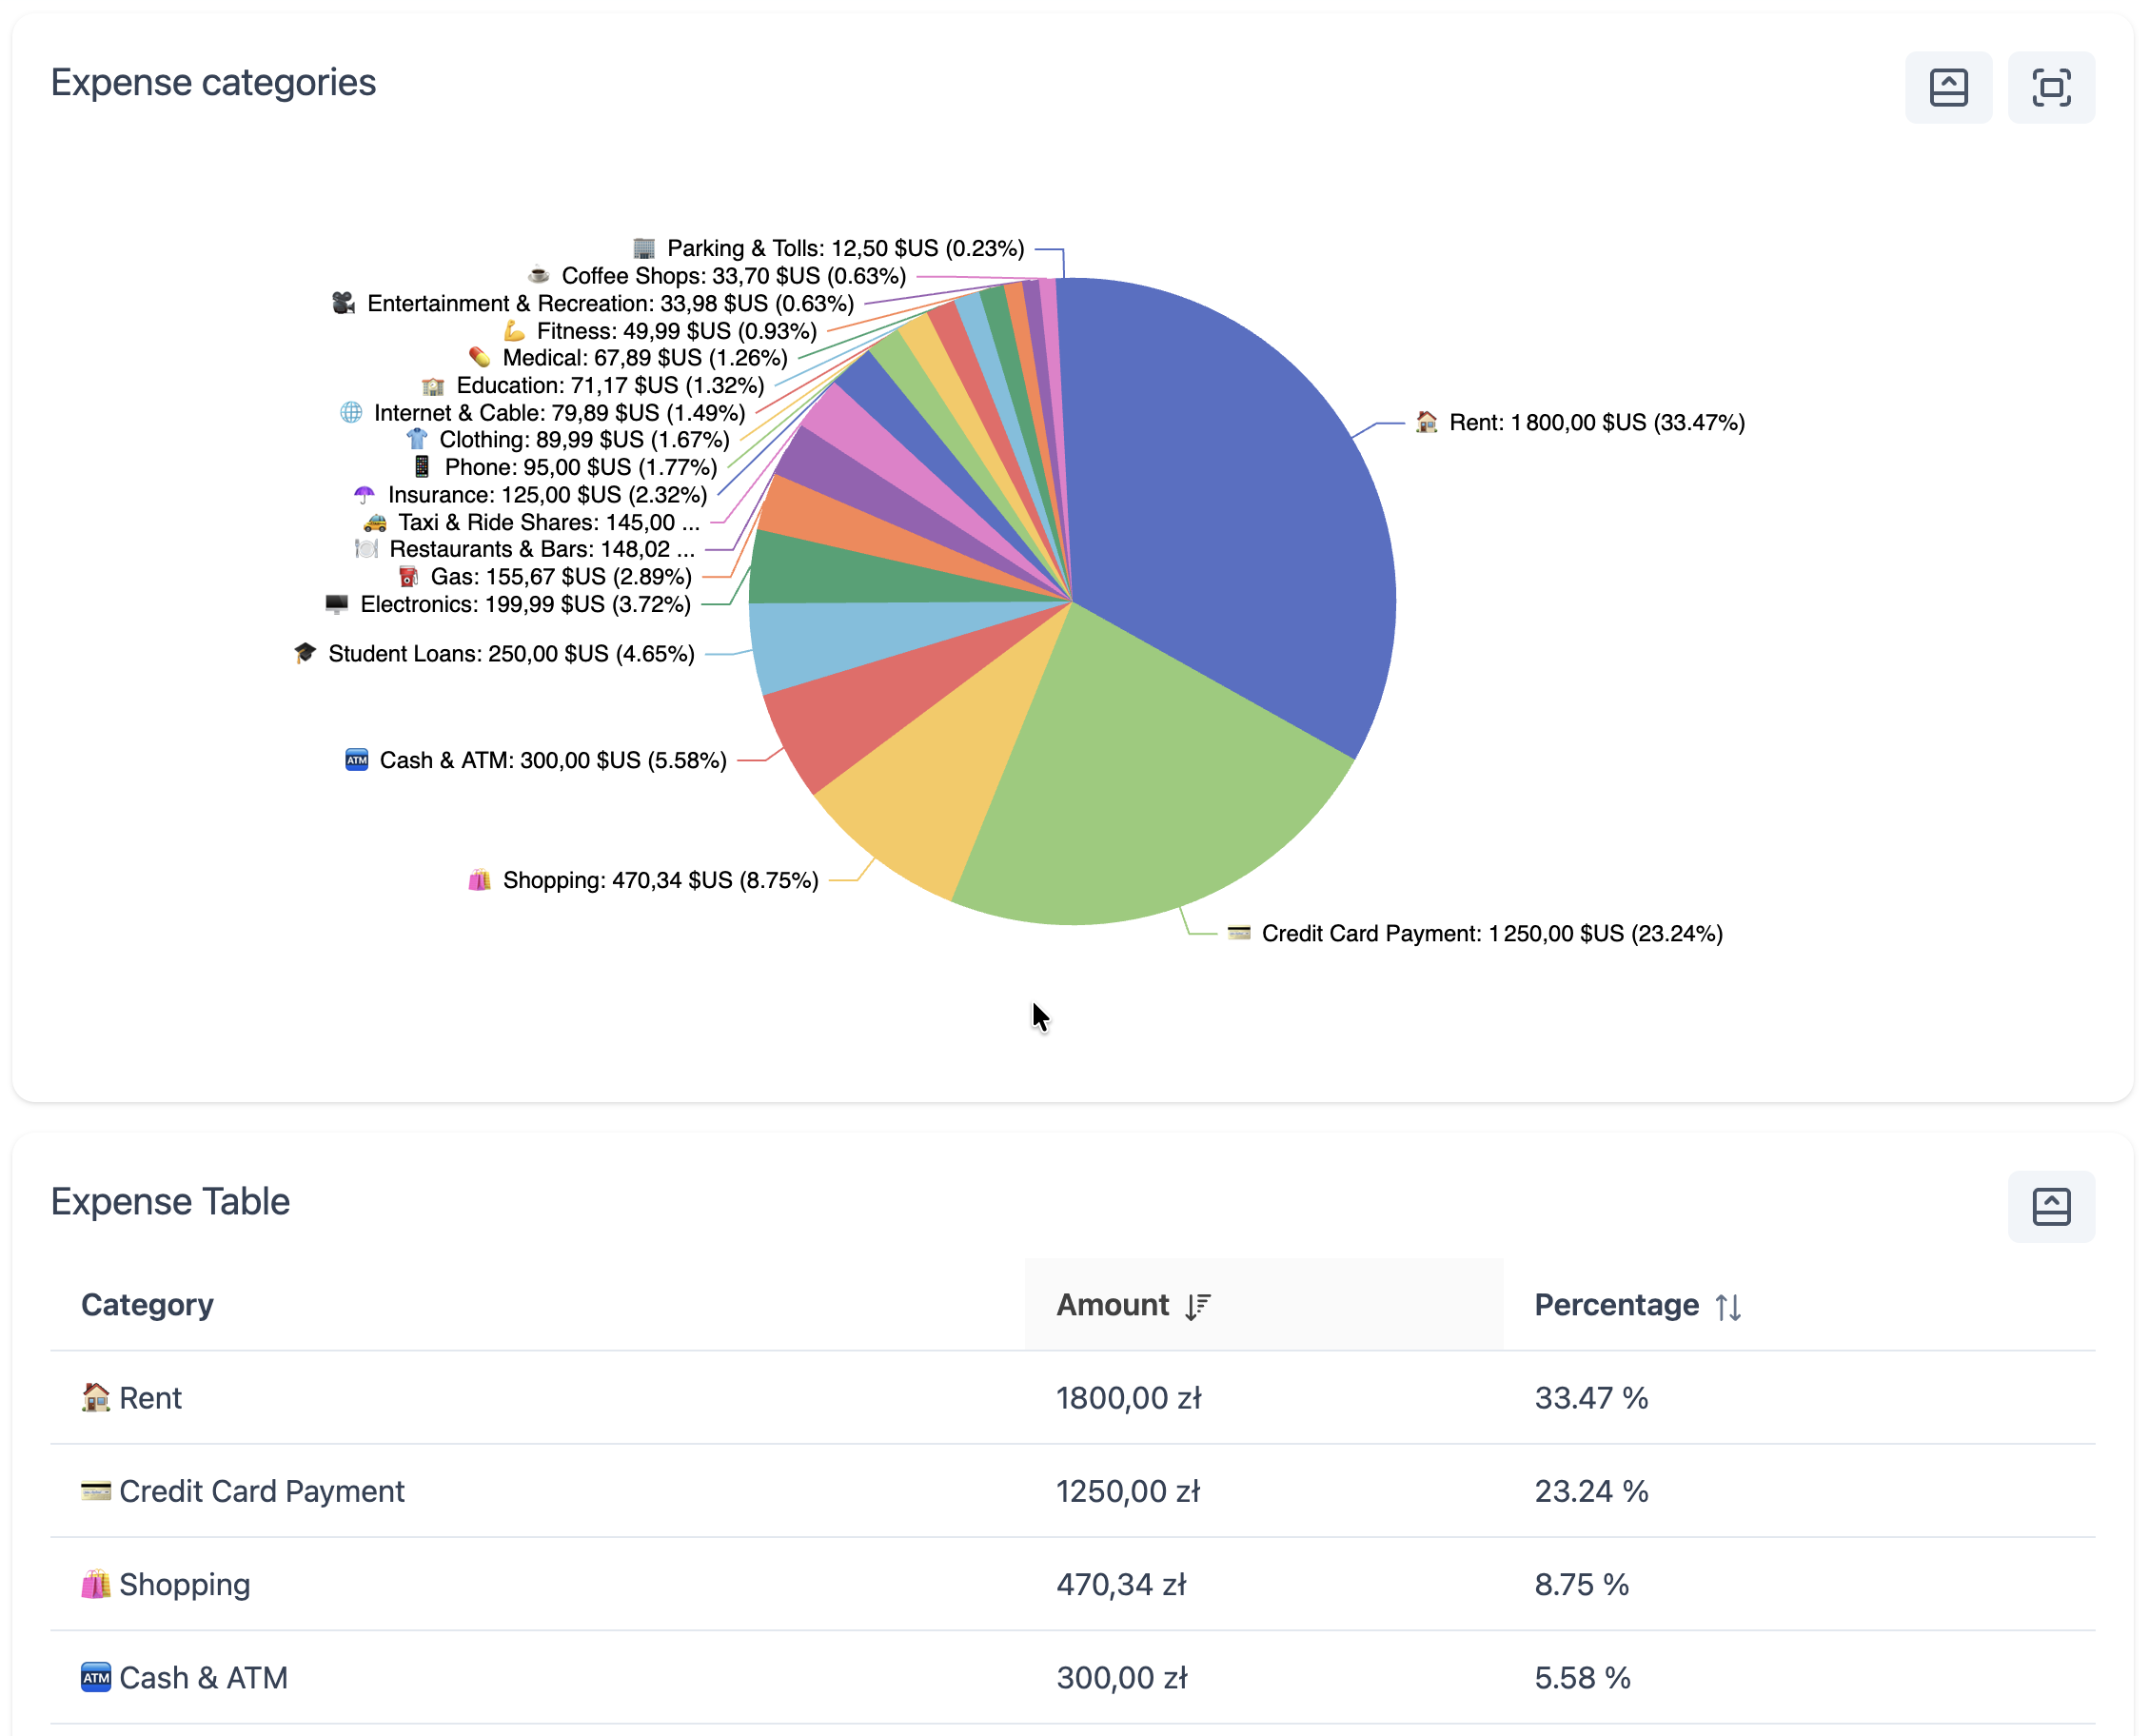
Step 6: Review and export
Review your dashboard with a breakdown of your spending.
You can export your processed data in PDF, CSV, or JSON formats.
This is a short guide to help you get started.
You can always return to this page for reference.
We’re also working on a more detailed guide - stay tuned.
Good luck with understanding and improving your spending habits! 🙏